How Much Does Manual HR Reporting Cost?
Manual HR reporting often costs more than organizations realize.
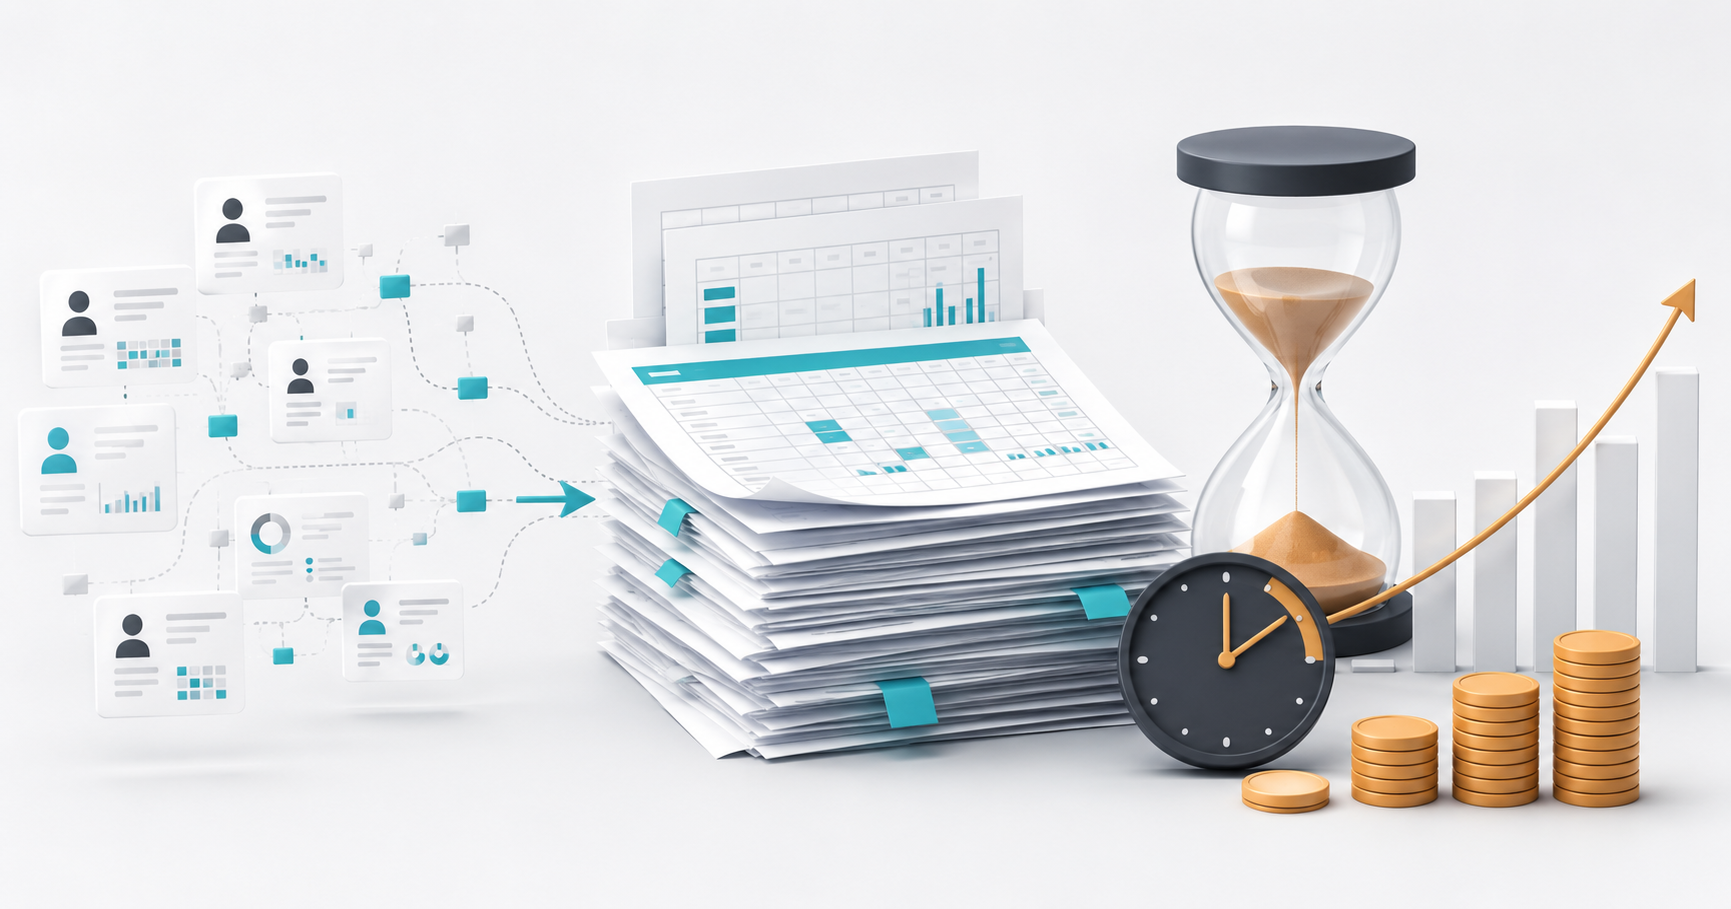
The expense rarely appears as a specific line item in the HR budget. Instead, it is distributed across hours spent exporting data, cleaning spreadsheets, reconciling systems, validating numbers, rebuilding reports, and responding to recurring requests from leadership.
For many HR teams, reporting has simply become part of the job.
But when the hours are calculated across an entire year, the hidden cost can be significant.
More importantly, every hour spent preparing data is an hour that cannot be spent helping leaders understand workforce trends, anticipate risks and make better people decisions.
What Is the Cost of Manual HR Reporting?
The cost of manual HR reporting is the total employee time and resources required to collect, prepare, validate, and distribute HR reports.
A simple way to estimate this cost is:
Monthly reporting hours × 12 × fully loaded hourly cost = estimated annual reporting cost
For example, imagine an HR team spends 60 hours per month preparing reports.
If the estimated fully loaded cost of the employees performing that work is $60 per hour:
60 hours × 12 months × $60 = $43,200 per year
That represents more than $40,000 in annual employee capacity dedicated to preparing reports.
And that estimate does not include the cost of reporting errors, delayed decisions, inconsistent metrics or the lost opportunity for HR professionals to focus on strategic workforce analysis
Why Does HR Reporting Take So Much Time?
Manual reporting is rarely caused by one inefficient employee or one poorly designed spreadsheet.
The problem is usually structural.
HR data is often distributed across multiple systems, including:
- — HRIS platforms
- — payroll systems
- — applicant tracking systems
- — learning management systems
- — performance management tools
- — benefits platforms
- — workforce scheduling systems
Each system may store information differently.
As a result, HR teams frequently export data from several platforms and manually combine it before analysis can begin.
This HR data fragmentation creates additional work at almost every stage of the reporting process.
What Activities Create Hidden HR Reporting Costs?
Several recurring activities contribute to the cost of manual HR reporting.
1. Exporting data
HR professionals may need to log into several systems and download multiple reports before creating a single workforce analysis.
2. Cleaning spreadsheets
Dates, employee IDs, department names, job titles, and other fields may use different formats across systems.
These inconsistencies must often be corrected manually.
3. Reconciling numbers
When two systems report different employee counts or workforce metrics, HR teams must investigate the discrepancy.
4. Rebuilding recurring reports
Many organizations recreate similar reports every week, month, or quarter.
The data changes.
The reporting process often does not.
5. Validating HR metrics
Leadership expects HR metrics to be accurate, consistent and trusted.
HR teams often spend significant time validating calculations before they can confidently support business decisions.
Using standardized HR metrics can reduce ambiguity and create greater consistency across recurring workforce reporting.
6. Responding to ad hoc requests
Questions such as:
- — What is our turnover rate?
- — Which departments have the highest absenteeism?
- — How has headcount changed?
- — What is our time-to-hire?
- — Where are we losing employees?
may require a new spreadsheet exercise every time they are asked.
What Is the Opportunity Cost of Manual HR Reporting?
The direct cost of reporting is only part of the problem.
There is also an opportunity cost.
Every hour spent preparing data is an hour that cannot be spent interpreting it.
This can prevent HR teams from focusing on higher-value activities such as:
- — workforce planning
- — retention analysis
- — talent strategy
- — organizational design
- — manager support
- — employee experience
- — strategic recommendations
The difference is important.
Reporting explains what happened.
People Analytics helps organizations understand why it happened and what to do next.
When HR professionals spend most of their reporting time assembling information, less capacity remains for analysis.
How Can You Calculate Your HR Reporting Cost?
Start by estimating the number of hours your team spends each month on reporting activities.
Include time spent:
- — extracting data
- — cleaning spreadsheets
- — combining systems
- — validating metrics
- — creating charts
- — updating presentations
- — distributing reports
- — answering recurring data requests
Next, estimate the average fully loaded hourly cost of the employees involved.
Then apply the following calculation:
Monthly reporting hours × 12 × fully loaded hourly cost
For example:
40 hours per month × 12 × $60/hour = $28,800 per year
At 80 hours per month:
80 × 12 × $60 = $57,600 per year
The objective is not to eliminate every reporting hour.
The objective is to identify how much time is being spent on repetitive data preparation that could potentially be automated.
How Much HR Reporting Can Be Automated?
The answer depends on the organization’s systems, data quality, and reporting environment.
However, repetitive reporting activities are often the strongest candidates for automation.
These can include:
- — recurring data consolidation
- — standardized KPI calculations
- — scheduled dashboard updates
- — workforce trend monitoring
- — recurring management reports
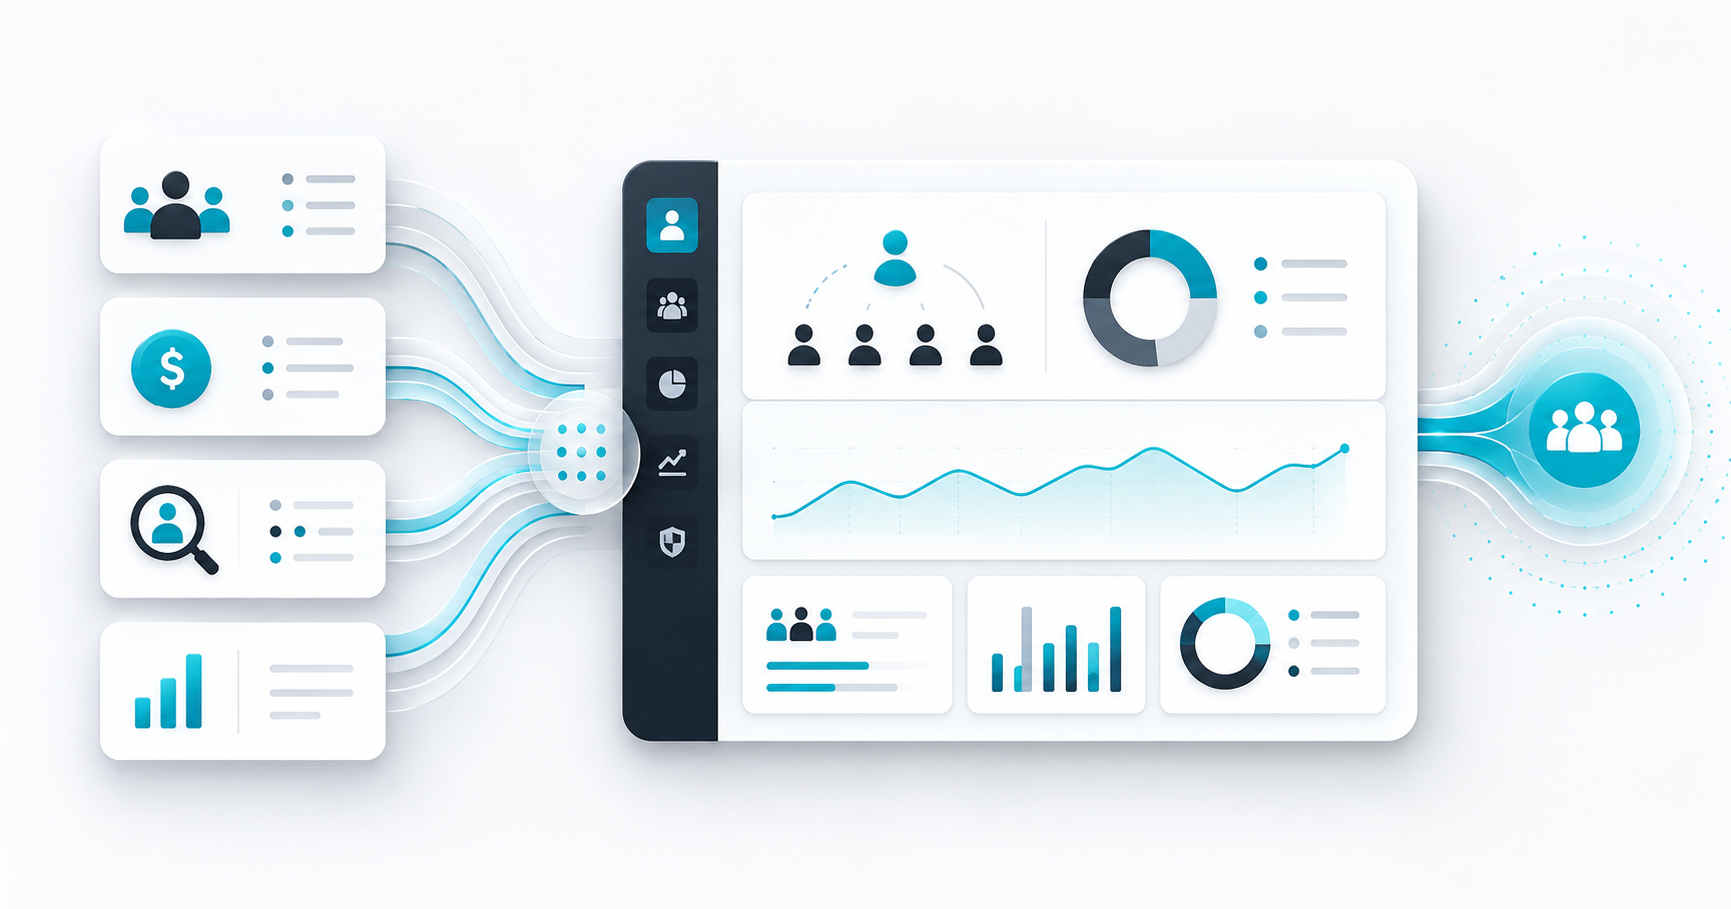
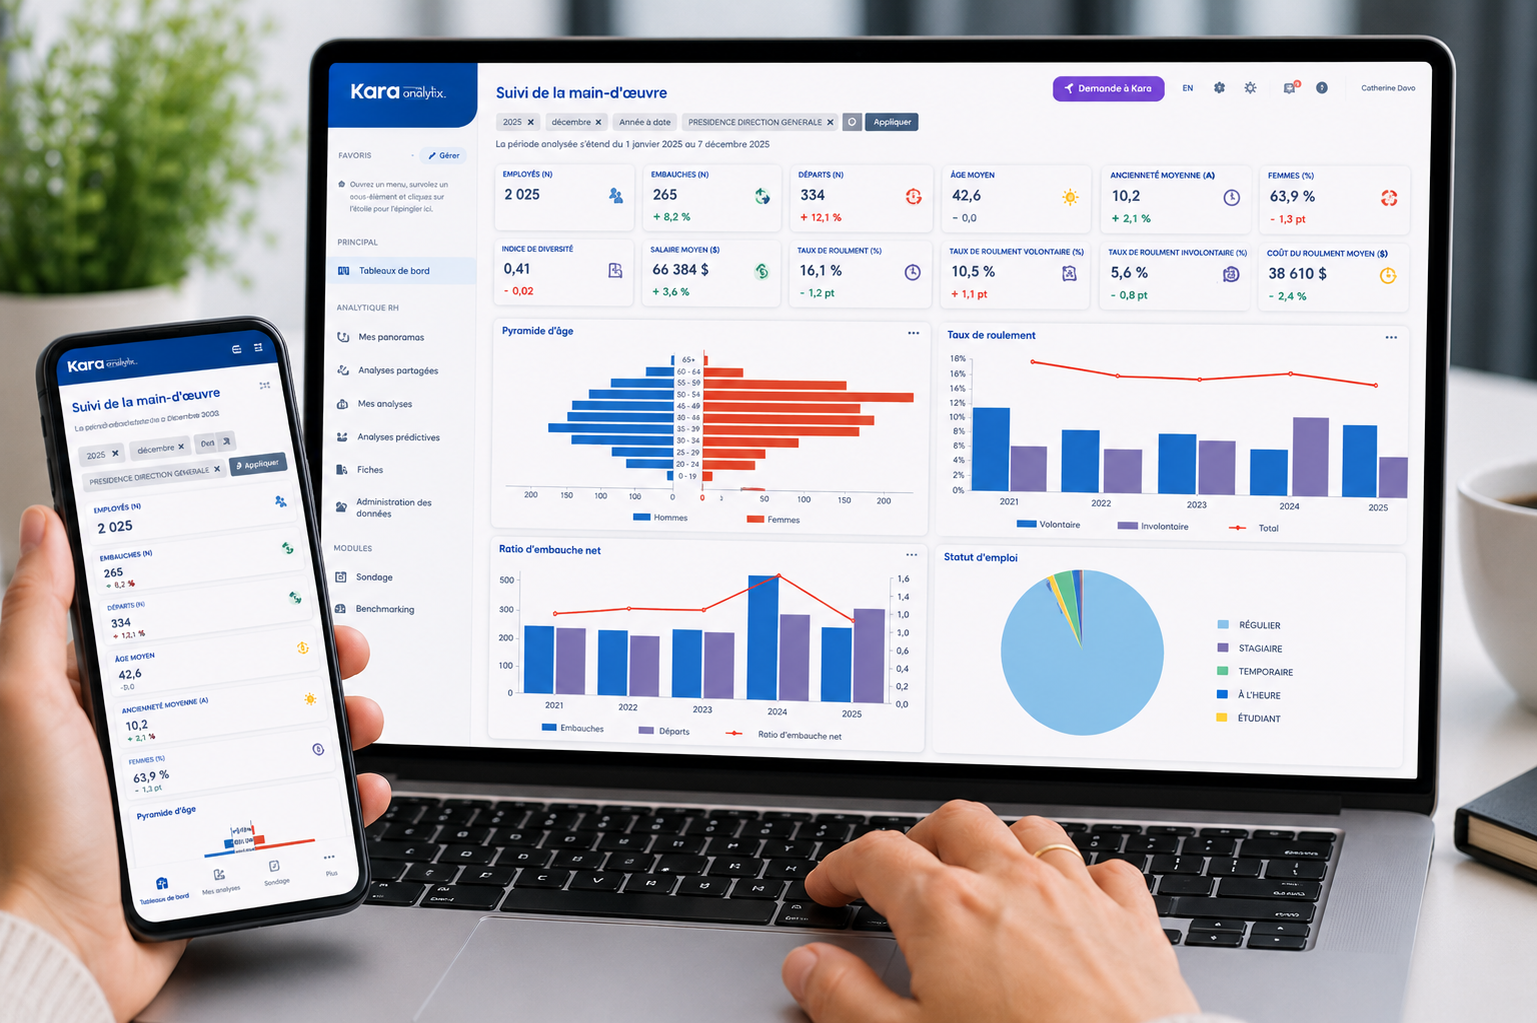
A People Analytics layer can help connect information from the existing HR technology ecosystem and create a more consistent
reporting environment without necessarily replacing the organization’s core HR systems.
The result isn’t simply faster reporting. It’s a shift from spending time preparing data to spending time generating insights that help
leaders make better workforce decisions.
How Do You Know If Your HR Reporting Process Is Inefficient?
Common warning signs include:
- — HR data is spread across several systems
- — spreadsheets are required for most reports
- — the same reports are rebuilt every month
- — leadership frequently waits for HR data
- — different teams calculate metrics differently
- — significant time is spent validating numbers
- — only a few employees understand the reporting process
If several of these conditions apply, the reporting process may contain significant manual effort.
Calculate the Hidden Cost of Your HR Reporting Process
Understanding the cost of manual reporting is often the first step toward building a more strategic, data-driven HR function.
Kara Analytix’s HR Reporting Efficiency Calculator estimates:
- — your annual HR reporting cost
- — potential reporting efficiency opportunities
- — estimated time savings
- — your HR reporting maturity level
The assessment takes approximately two minutes.
→ Calculate Your HR Reporting Efficiency
FAQ
How much time do HR teams spend on reporting?
The amount varies based on company size, HR technology, data complexity, and reporting requirements. Organizations using multiple disconnected HR systems may spend significant time extracting, cleaning, and reconciling workforce data.
What is manual HR reporting?
Manual HR reporting is a process where employees repeatedly extract, combine, clean, calculate, and present HR data using tools such as spreadsheets and static reports.
Why is manual HR reporting expensive?
The cost comes from employee time spent preparing data instead of analyzing it. Additional costs may result from reporting errors, inconsistent metrics, and delayed access to workforce information.
Can HR reporting be automated?
Many repetitive reporting activities can be automated, including data consolidation, recurring KPI calculations, dashboard updates, and scheduled reports.
How do you calculate HR reporting costs?
Estimate the number of hours spent on HR reporting each month, multiply that number by 12, and multiply the result by the fully loaded hourly cost of the employees performing the work.