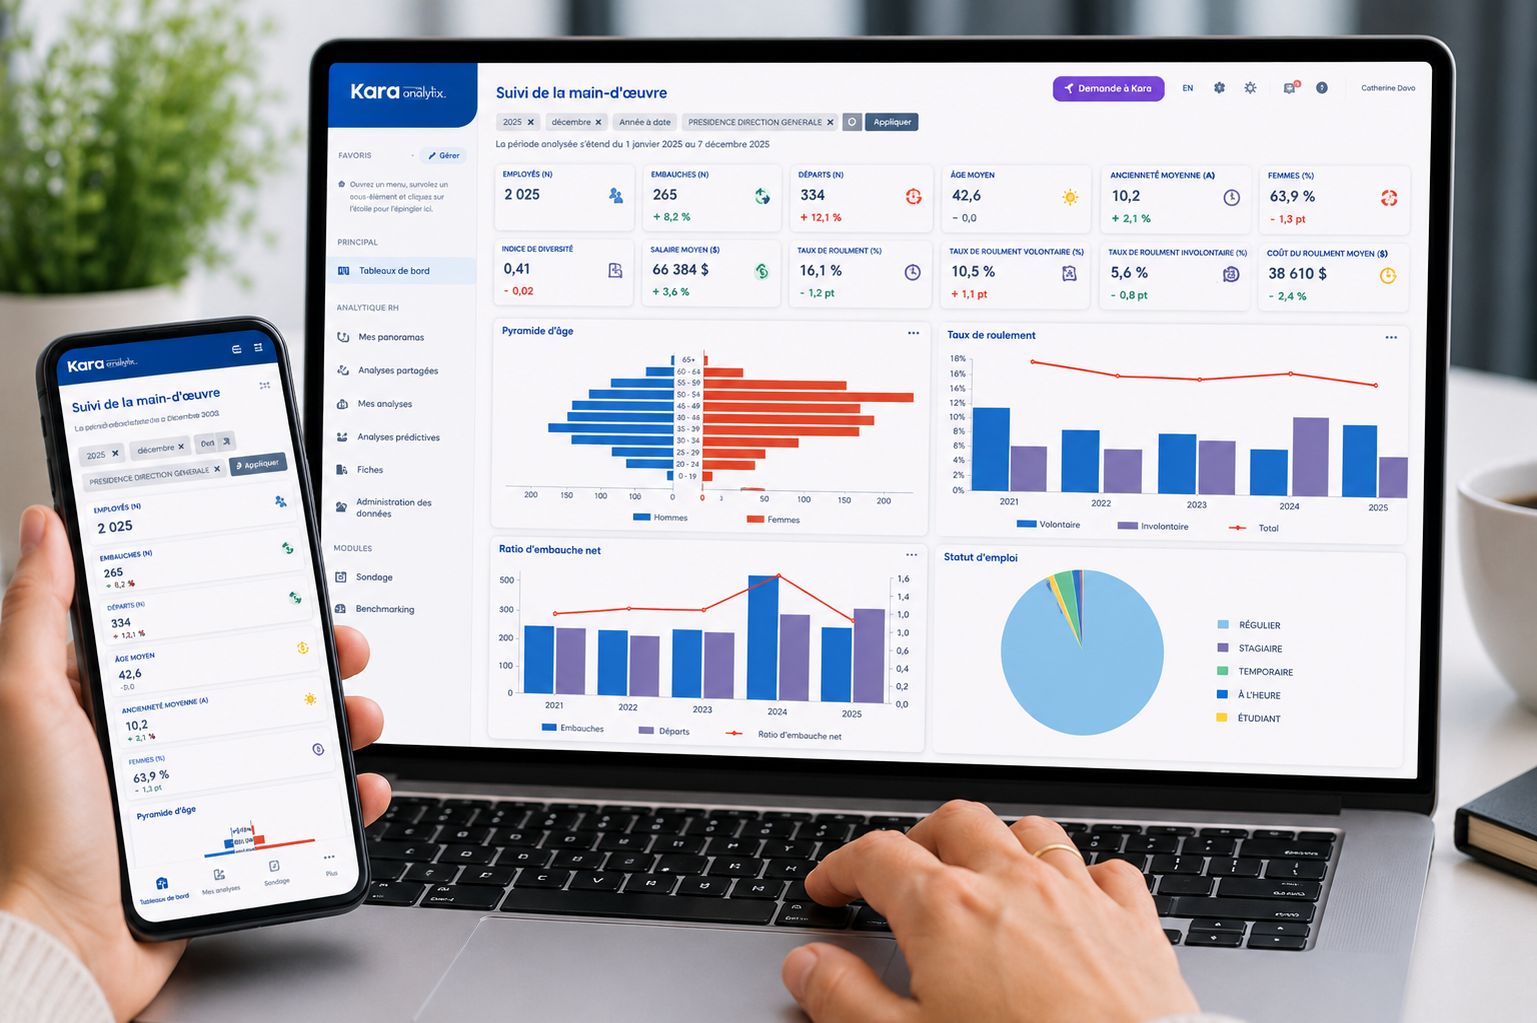

Which HR Metrics Should You Report to Your Board?
Choose board HR metrics by starting with strategic priorities and the human capital risks the board needs to monitor. Then select measures that explain how those issues are evolving, put changes in context and support follow-up on the actions implemented by management. No universal KPI list fits every organization.
A business opening new locations will have different priorities from one protecting scarce expertise. Your selection should reflect those differences, even when both organizations have the same types of HR data available.
Start with a question the board needs to examine
Before adding a metric, write down the question it will help answer. “How many employees do we have?” describes a situation. “Is our workforce growing in the functions needed to deliver our plan?” connects that situation to a business issue.
Use the following matrix as a starting point. These are possible measures to adapt, not a mandatory reporting list.
| Priority | Question to address | Possible metrics |
|---|---|---|
| Growth capacity | Do we have the workforce and skills needed to support our growth plan? | Headcount by function, vacant strategic positions, time to hire for key roles and new-hire retention rates. |
| Continuity and expertise | Are departures weakening critical functions? | Turnover rates in critical functions; proportion of critical roles with identified successors. |
| Workforce availability | Could workforce availability challenges compromise our operational capacity? | Absenteeism rates, overtime hours and vacancy rates in critical areas. |
| Labour costs | Are labour costs evolving in line with our forecasts, and which variances could affect our objectives? | Payroll and budget variance; overtime and absence costs. |
Depending on your context, engagement, internal mobility, skills, or occupational health and safety may also deserve a place in the board dashboard. In some sectors, particularly industrial settings, health and safety risks or the availability of critical skills may be major strategic issues. The choice of metrics should always reflect your organization’s own priorities and risks.
Apply four criteria to each candidate metric
Use the same selection criteria across business units and reporting topics:
- Relevance: which priority does the metric address?
- Use: which discussion, oversight activity or decision can it inform?
- Reliability: will sufficiently sound data be available when needed?
- Contribution: does it add information beyond the measures already selected?
A metric whose interpretation is too complex for a summary, or whose connection to a strategic issue is limited, may be reserved for management analysis.
For an organization with multiple sites or business units, apply these questions consistently while allowing priorities to differ. A site-specific staffing issue belongs in the board summary when its implications justify that level of attention.
Download Kara’s HR dashboard white paper to apply this selection process and prepare a useful summary for leadership and the board.
Clarify what a measure can actually tell you
A turnover rate describes departures within a defined population and period. It does not automatically reveal why people left. Training participation describes program delivery; it does not, by itself, demonstrate that employees acquired skills or used them at work.
Similarly, rising internal mobility may reflect development opportunities and better movement of talent, but its interpretation depends on the nature of those moves and their effects on teams.
Attach a short interpretation to each selected result: what it shows, what needs investigation and what the possible consequences are and, where relevant, the actions planned by management. This keeps recommendations aligned with the available evidence and makes uncertainty easier to discuss.
Document the definition before comparing results
For every selected metric, record the definition and calculation method, population, exclusions, period, source and refresh frequency. Identify someone who can explain those rules and investigate anomalies.
For turnover, which departures are included, and how is reference headcount calculated? For new-hire retention, have all cohorts had enough follow-up time? For absenteeism, which absence categories and hours enter the calculation?
These questions help prevent comparisons between results that share a label but measure different things. Also ensure definitions remain stable over time so that observed variations reflect real changes rather than methodological adjustments. Our article on HR data quality explains this foundation in more detail.
Document changes as well. If a new source expands the population covered, explain whether earlier periods were recalculated. A movement caused by a reporting change should not be presented as a change in workforce behaviour.
Choose a reference point and plan the follow-up
A result becomes more useful alongside a trend, internal target or relevant comparison. The trend shows how the result evolves, the target measures progress toward objectives, and the benchmark places the organization’s performance in relation to comparable organizations. Before using an external benchmark, check definitions, timing, industry, organization size and the composition of the comparison group.
Then determine the monitoring frequency. For example, HR may examine certain issues monthly and provide a quarterly board summary, depending on their importance and the governance calendar. Define which circumstances would justify an earlier alert.
Periodically reassess your selection so that the metrics presented to the board remain aligned with strategic priorities and emerging risks. Our guidance on presenting HR results to leadership can help you test whether the selected information is understandable.
Frequently asked questions
How many HR metrics should a board receive?
Use enough to explain priority issues and interpret the results. If the summary becomes difficult to read, move supporting detail into appendices instead of adding more measures. The goal is not to present as many metrics as possible, but to help directors quickly identify trends, variances and risks that deserve their attention.
Should the dashboard focus only on financial metrics?
Costs provide useful context, but workforce risks may also involve expertise, operational capacity or succession. Select measures around the issue, then examine relevant operational and financial consequences.
Ready to revisit your selection? Explore Kara’s white paper and connect each metric to a question your board needs to examine.