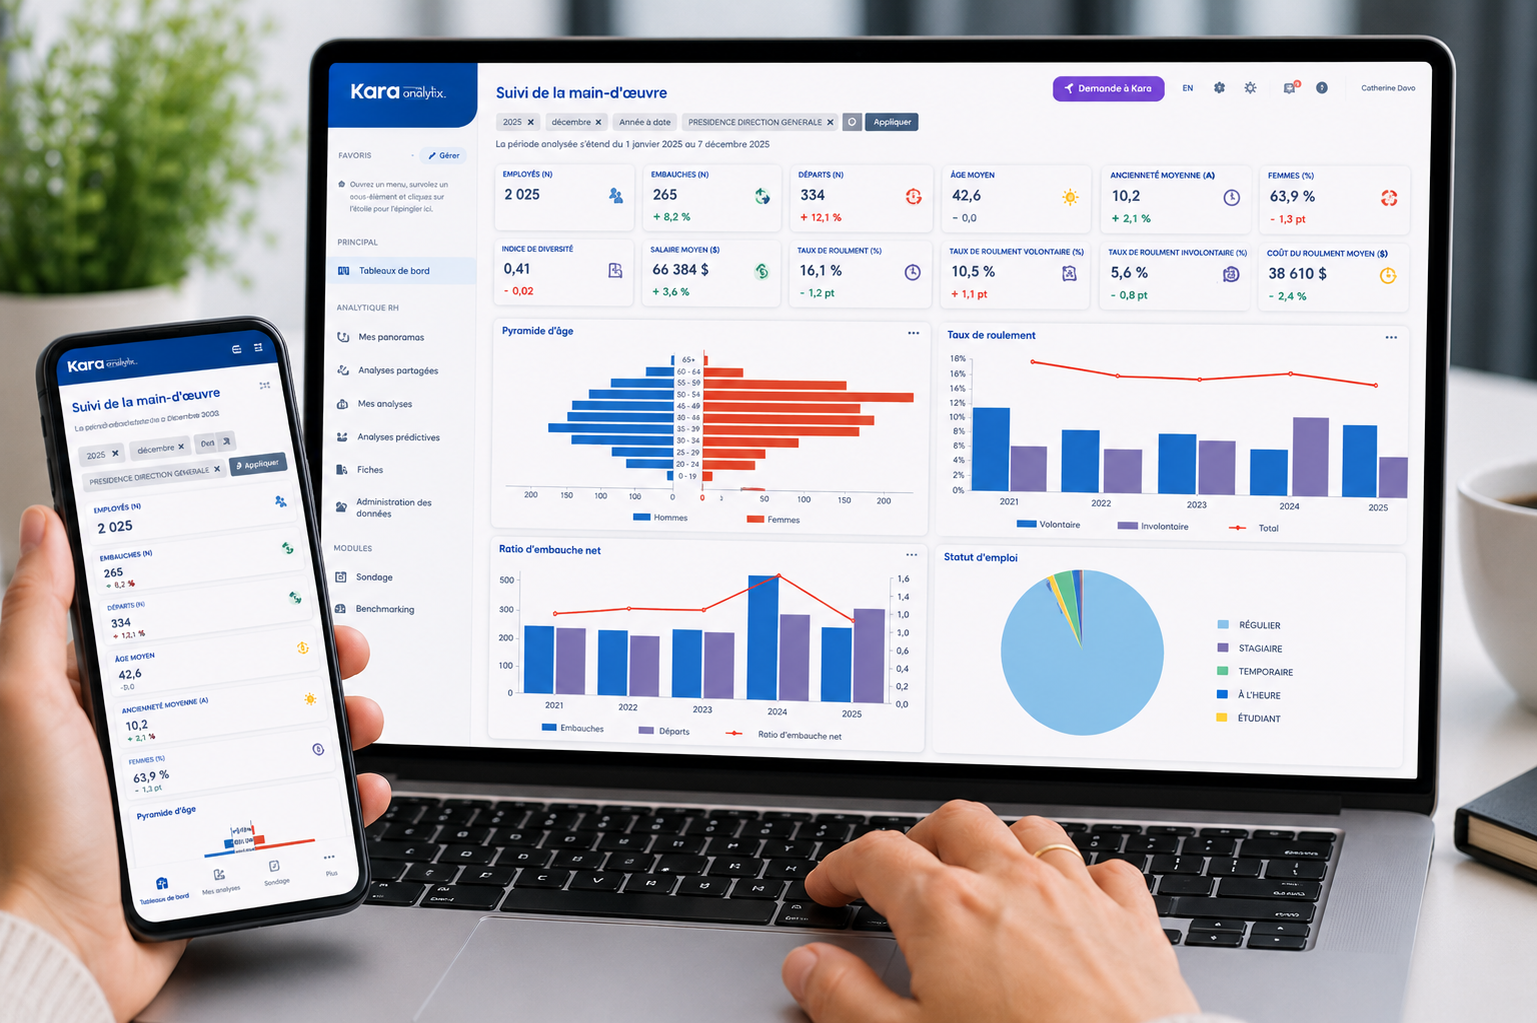
Even today, HR in some organizations is still too often seen as just a cost center or a support function. Yet, when you rely on data, it becomes clear that human resources play a strategic role in business performance.
Turnover rates, employee engagement, and productivity are not just HR metrics—they are powerful financial levers that can influence growth, profitability, and the long-term sustainability of your organization.
So, how can you concretely link your HR data to financial results? Here are three essentials.
The Real Cost of Employee Turnover
recruitment, onboarding, training, loss of know-how, and a temporary drop in productivity.
Studies estimate that replacing an employee costs between 30% and 400% of their annual salary (depending on the role, responsibilities, and hierarchical level).
Let’s take a concrete example:
- A company with 200 employees
- An average salary of $60,000
- An annual turnover rate of 20%
This means that 40 employees leave the organization every year. If each departure costs an average of $75,000, the company loses $3 million annually due to turnover alone.
By measuring turnover rates by department, seniority, or job type, you can quickly identify critical areas. This is the first step toward targeted actions: retention programs, improved onboarding, or recognition initiatives.
Engagement as a Performance Driver
Employee engagement is directly tied to organizational performance. Engaged teams are more productive, have lower absenteeism, and generate more innovative ideas.
A motivated employee is also more likely to deliver better service, which impacts customer satisfaction and, ultimately, sales.
For example, organizations that regularly track engagement survey results often find that even a 5-point increase in engagement can significantly reduce turnover. Each point gained translates into concrete savings and improved productivity.
As you can see, engagement—when measured and analyzed—becomes a key indicator for predicting performance, turnover (and its associated costs), and more.
Connecting HR Metrics with Financial Results
The true value of HR analytics lies in the ability to connect HR data with financial data. Here are some concrete examples:
- Turnover ↔ recruitment and training costs
Every employee departure requires an investment of time and money. Tracking this correlation helps quantify turnover’s impact on profitability.
- Engagement ↔ productivity ↔ sales or customer satisfaction
A department where engagement drops may experience declining sales or rising customer complaints.
- Absenteeism ↔ revenue loss or quality decline
Each absence day carries both direct costs (replacement) and indirect costs (delays, colleague overload, reduced service quality).
By integrating these correlations into HR-finance dashboards, executives can make better-informed decisions. For example:
- Investing in wellness programs if absenteeism is rising,
- Revisiting recruitment strategies for positions with higher turnover,
- Prioritizing specific training programs for targeted teams.
How to Take Action in Your Organization
Linking HR data to business performance may seem complex at first glance, but it’s primarily a matter of method:
- Define the right HR metrics
- Turnover (voluntary/involuntary, by department, by seniority)
- Engagement (mobilization rate, participation rate in initiatives, eNPS)
Absenteeism (lost days, disability, trends over time)
Recruitment and training costs
Cross these metrics with financial dataSales, profit margin, operating costs, customer satisfaction.
Example: Compare the turnover rate in a sales team with changes in revenue.
Present results in strategic languageUse clear dashboards with simple correlations: “Each additional 1% turnover = $250,000 annual loss.”
Highlight scenarios: “If we reduce turnover by 5 points, we save about $750,000 annually.”
Act and measure the impactImplement targeted initiatives (retention, training, wellness).
Track the evolution of metrics and demonstrate the financial impact of HR actions.
Human resources are a major strategic performance lever for all types of organizations. By linking your HR data to financial results, you concretely demonstrate the added value of your HR initiatives and speak the language of executives.
The question is no longer “How much do our employees cost?” but rather “What value do they generate for the organization?”
By putting People Analytics at the service of business strategy, organizations turn HR decisions into a lasting competitive advantage.
- Absenteeism (lost days, disability, trends over time)
- Recruitment and training costs
Cross these metrics with financial dataSales, profit margin, operating costs, customer satisfaction.
Example: Compare the turnover rate in a sales team with changes in revenue.
Present results in strategic languageUse clear dashboards with simple correlations: “Each additional 1% turnover = $250,000 annual loss.”
Highlight scenarios: “If we reduce turnover by 5 points, we save about $750,000 annually.”
Act and measure the impactImplement targeted initiatives (retention, training, wellness).
Track the evolution of metrics and demonstrate the financial impact of HR actions.
Human resources are a major strategic performance lever for all types of organizations. By linking your HR data to financial results, you concretely demonstrate the added value of your HR initiatives and speak the language of executives.
The question is no longer “How much do our employees cost?” but rather “What value do they generate for the organization?”
By putting People Analytics at the service of business strategy, organizations turn HR decisions into a lasting competitive advantage.
- Cross these metrics with financial data
- Sales, profit margin, operating costs, customer satisfaction.
- Example: Compare the turnover rate in a sales team with changes in revenue..
- Present results in strategic language
- Use clear dashboards with simple correlations: “Each additional 1% turnover = $250,000 annual loss.”
- Highlight scenarios: “If we reduce turnover by 5 points, we save about $750,000 annually.”
- Act and measure the impact
- Implement targeted initiatives (retention, training, wellness).
- Track the evolution of metrics and demonstrate the financial impact of HR actions.
Human resources are a major strategic performance lever for all types of organizations. By linking your HR data to financial results, you concretely demonstrate the added value of your HR initiatives and speak the language of executives.
The question is no longer “How much do our employees cost?” but rather “What value do they generate for the organization?”
By putting People Analytics at the service of business strategy, organizations turn HR decisions into a lasting competitive advantage.